Summary Reports
The Summarise Menu option provides access to some quick and simple ways to view data summaries from iRecord.
General Summaries
Click on the Summarise > General Summaries menu item to access a collection of reports summarising the records you have entered as well as the records entered into iRecord as a whole.
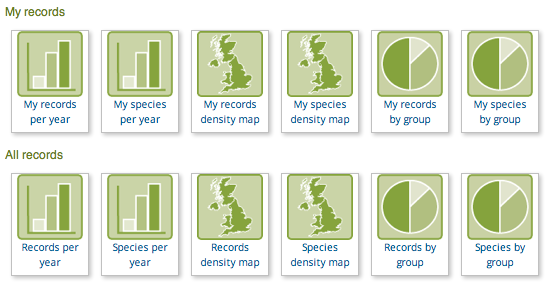
Hopefully the report titles are fairly self-explanatory. Here are a couple of examples
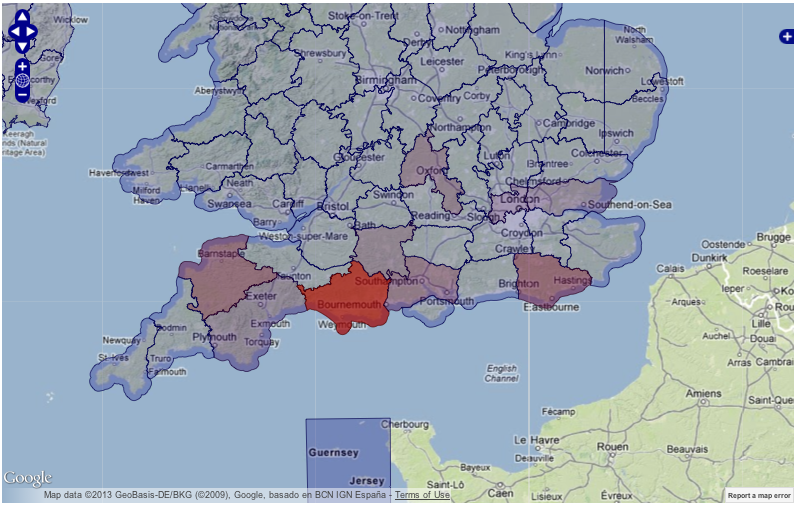
The My records density map page provides you with a vice county level heat map of where you have input your records:
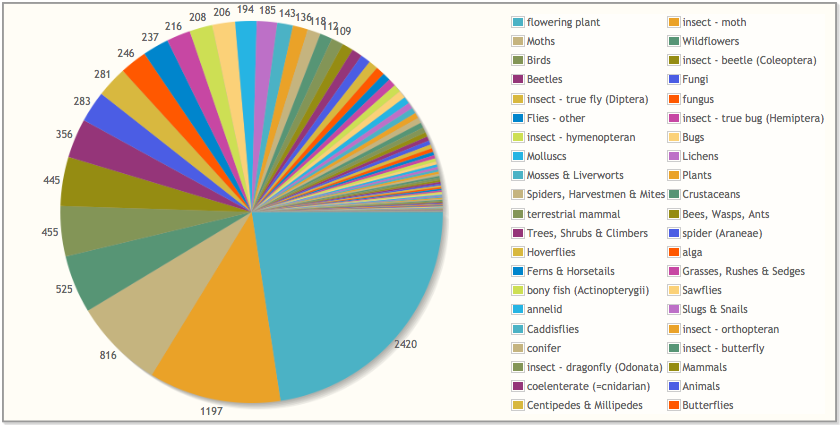
The Species by group pie chart shows the relative number of species recorded in each species group:
Tip
Have a play with the different charts available and try clicking on the pie segments, chart bars and map regions to quickly access a filtered version of the Explore page showing the underlying records and species.
Survey Summaries
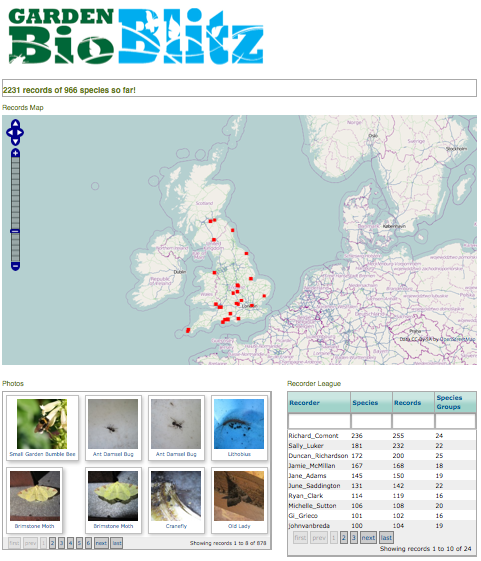
Specific surveys which host their records on iRecord sometimes opt to provide a summary page to show progress. This might apply to a bioblitz or a survey of a specific site, for example. These summary pages are listed under the Summarise > Survey summaries menu item. Here’s a screenshot of the summary page available for the 2012 Garden Bioblitz trial:
![]()
Project Versions
RTD Search
Full-text doc search.